Math Arguments
Problems, Questions, and Puzzles to spark discussion and argument in the maths classroom.
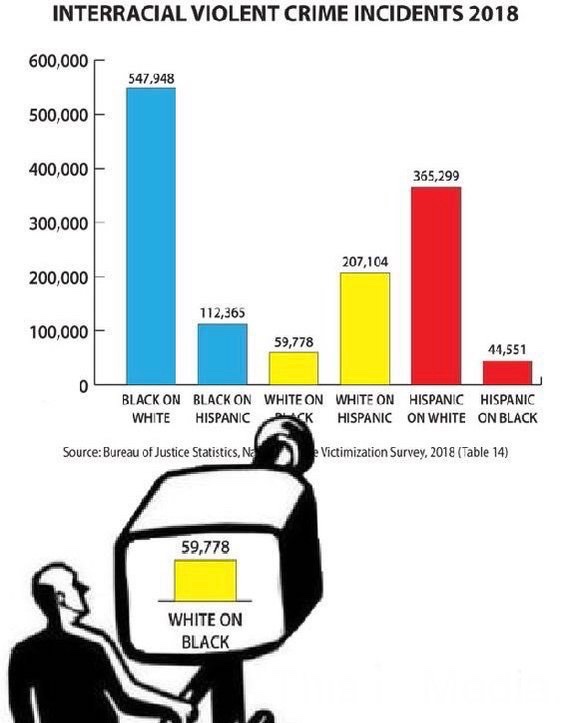
How do You Respond to This Graph?
Consider the graph, the creator, the reason for creating it, the data included. What's your reaction?
Continue down to see a screenshot of Elon Musk's response and read the thread from a data scientist. Did you notice what he noticed? Do you agree with him?
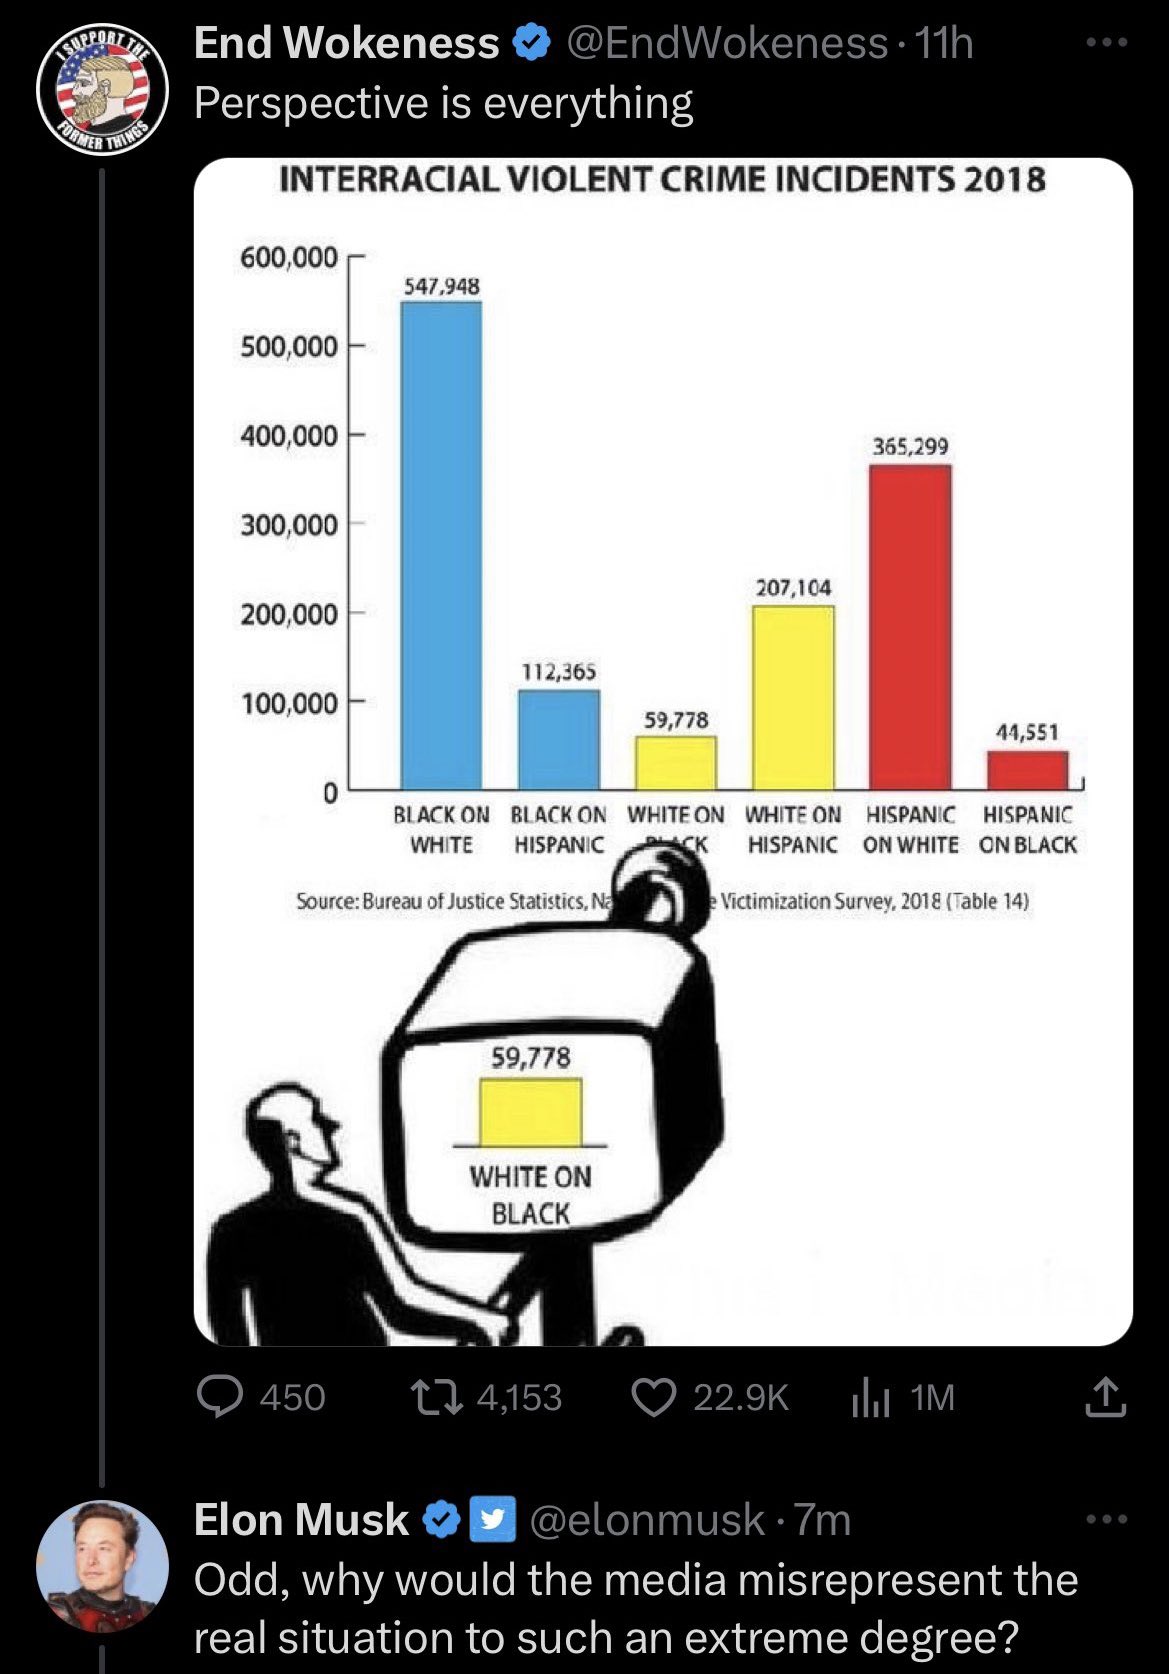
Here is Kareem Carr's (@kareem_carr) response to this graph and Elon Musk's reaction to it.
Carr:
"This bar chart has attracted the attention of the richest man in the world. Let me walk you through how I would interpret it as a statistician (and a human).
I am sure this data is in many ways dubious and the claim that the media exclusively focuses on white-on-black crime is untrue but let’s set that aside for now. I want to talk about the biases in how people present data.
I like to say Statistics is critical thinking with numbers. As a statistician, I want these numbers to help me understand *why* things are happening and what I can do about it.
We want to learn about *causation* not just correlation. For this reason, how we frame the data is extremely important.
Now, I would suspect if the media did disproportionally focus on white-on-black crime, it would be because they have a good faith belief that the causal element in those particular incidents is anti-black racism.
Since they are interested in highlighting that particular cause of crime, it would be reasonable to focus on that data. To understand if their lack of focus on black-on-white crime is unreasonable, we would need to ask ourselves the following question:
Do we think that the primary cause of black-on-white crime in America is anti-white racism or is it vastly more likely that it’s because Black Americans are disproportionately poor and White Americans are disproportionately rich?
If we *do* think the causation is different then it makes sense that the media’s focus differs as well. This is why prior knowledge and expertise are so important in statistics. The naive number cruncher treats everything the same and fumbles the data analysis as a result.
The way the original bar chart tallies up crime by the race of the victim and of the perpetrator imposes a conclusion on the viewer that crime is primarily monocausal and that the single most important cause is race.
The chart does even more than that. It sets up the *harm* of crime as a harm done not just to the individual but to their entire race. In cases where the crime is racially motivated, this makes sense but not all crime is racially motivated.
Framing all crime as a form of racial harm comes off as white nationalist framing to me and this presentation of the data leads the viewer down a merry path to white nationalist solutions.
Notice that the chart excludes cases where the race of the victim and the perpetrator are the same. This reinforces the framing of crime as a form of harm that one race perpetrates against another since incidents where its the same race aren’t even counted here as harms.
The numbers for incidents where the race of the perpetrator and the victim are the same are probably huge and that would make these numbers look minuscule which would undermine the implicit argument for racial grievance being made here."
Graphicacy:
Graphicacy is the ability to read or create a visual (usually in graph form); the visual must communicate well with the reader. Generally, if it takes the reader more than a few seconds to figure out what's going on, it's a bad diagram or graph.
INTERPRET THE VISUAL. What is it saying? What point is it trying to make?
Is this visual distorted or misleading? Could quick interpretations of it jump to wrong conclusions? If so, what incorrect conclusions might be drawn? How is it communicating badly: what normal assumptions and expectations does this graph contradict? What errors did the creator make?
Would you change or fix the graph? If so, how would you change it? Do you think this visual was drawn this way on purpose, or is this a mistake or just a matter of incompetence? Is this the best type of graph/visual for this data?
This bar chart has attracted the attention of the richest man in the world. Let me walk you through how I would interpret it as a statistician (and a human). pic.twitter.com/2FTpCjUZXp
— Kareem Carr | Data Scientist | 📊📈📚 (@kareem_carr) May 6, 2023
Graphicacy (a variation of the words "Literacy" and "Numeracy") means the ability to read and understand the visual representation of data and ideas. Most commonly, we are interpreting bar charts, pie charts, scatterplots and other data representations, but the rise in the use of infographics has meant that Math teachers must teach this new literacy.
The second aspect of graphicacy is the identification and correction of bad graphics that push a distorted interpretation of the data. Often for political purposes, the promotion of deliberately incorrect or distorted graphs can be damaging to the country, to democracy, or to the health and well-being of the reader. In the words of Mark Twain, "There are three ways to lie. Lies, Damned Lies, and Statistics."
The quintessential Bad Graph: Gun Deaths in Florida
 ++
++